Let us consider experiment 2.1, wherein, a negative step change of 5 C (from 42C to 37C) was provided to set point at time t=250 s and a step change to fan was provided at t = 500 s, from 150 to 100.
Figure 10.5:
Xcos output for negative Step Change to Set Point and Fan
|
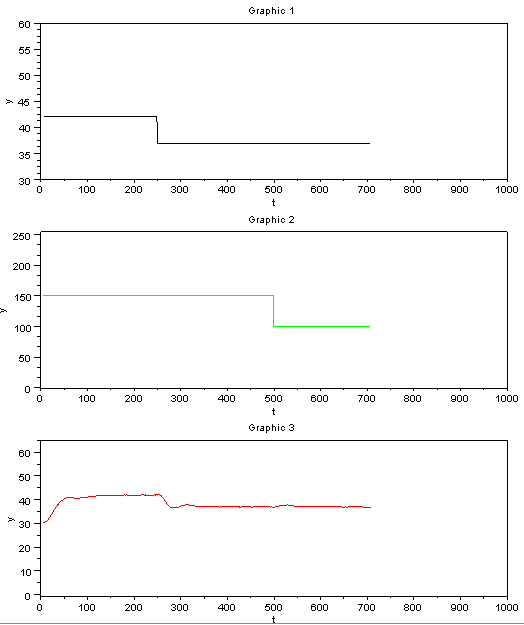 |
Figure 10.6:
Temperature and Heater plot
|
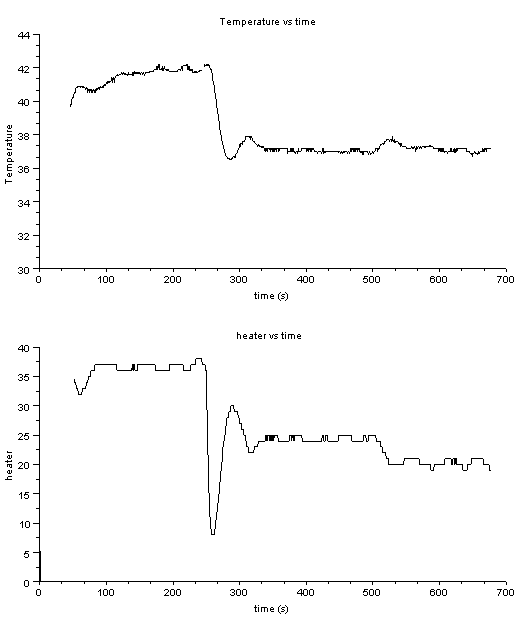 |
As can be seen from the graphs above, when the temperature set point drops at t=250 s, the value of the heater too falls, so that the plant (SBHS blade) can cool down to the required set point. Similarly, when the fan speed was decreased at t=500s, the heater value decreased yet again to maintain the same constant temperature of the SBHS blade.
rokade
2017-04-23