Next: Conducting experiments over virtual Up: Conducting experiments using the Previous: Configuring proxy settings and
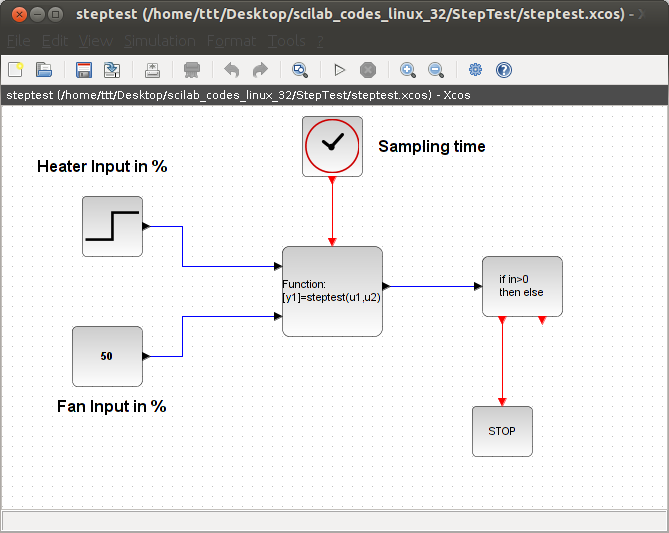
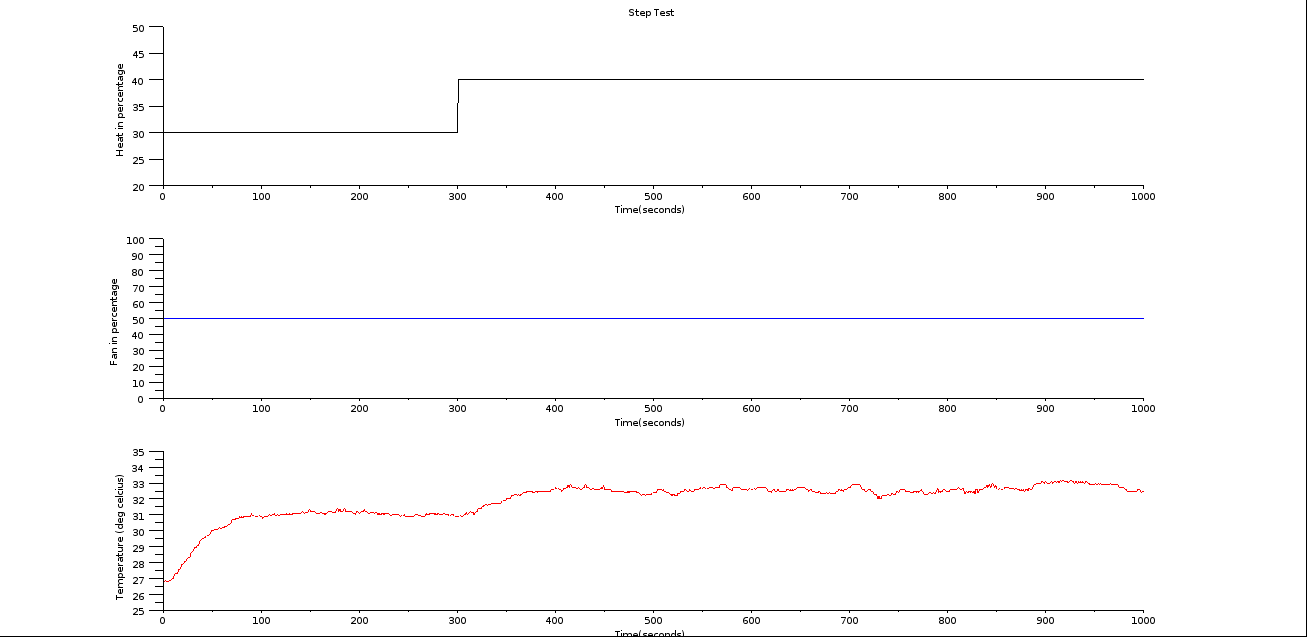
The experiment sampling time can be set inside the stepc.sce file. You may want to change it to a higher value if your network is slow. The default value of 1 second works fine in most cases. On the menu bar, click on Execute option and choose option file with echo. This will execute the scilab code. If the network is working fine, an xcos diagram will open automatically. If it doesnt open then see the scilab console for error messages. If you get a No network connection error message then try executing the scilab code again. The xcos diagram is for the step test experiment as shown in Fig. 1.5. You can set the value of the heat and fan. Keep the default values. On the menu bar of the xcos window, click on start button. This will execute the xcos diagram. If there is no error, you will get a graphic window with three plots. It will show the value of Heat in % Fan in % and ..temperature in degree celcius as shown in Fig. 1.6. After sufficient time of experimentation click on the stop button to stop the experiment. Go to the StepTest folder. Here you will find a logs folder. This folder will have another folder named after your username. It will have the log file for your experiment. Read the log file name as
YearMonthDate_hours_minutes_seconds.txt. This log file contains all the values of heat fan and temperature. It can be used for further analysis.
rokade 2017-04-23