Next: PID controller theory Up: Step Test Experiments and Previous: Conventional Controller Design
L = 6
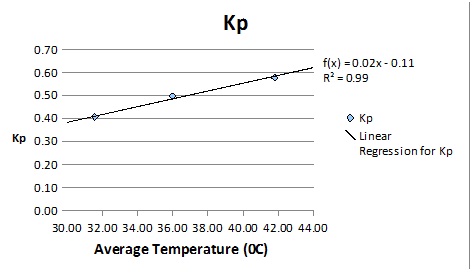
R = (0.016![]() T-0.114)/(66.90-0.415
T-0.114)/(66.90-0.415![]() T) where T is the temperature
T) where T is the temperature
Kc = 0.9(66.90-0.415T)/6(0.016T-0.114)
= (60.21 - 0.3735T)/(0.096T - 0.684)
![]() = 3
= 3 ![]() 6 = 18
6 = 18
L = 6
R = (0.016 ![]() T-0.114)/(66.90-0.415
T-0.114)/(66.90-0.415 ![]() T) where T is the temperature
T) where T is the temperature
K = 1.2(66.90-0.415T)/6(0.016T-0.114)
= (80.28 - 0.498T)/(0.096T - 0.684)
![]() = 2
= 2 ![]() 6 = 12
6 = 12
![]() = 0.5
= 0.5![]() 6 = 3
6 = 3
K = 2/(0.016![]() T-0.114)
T-0.114)
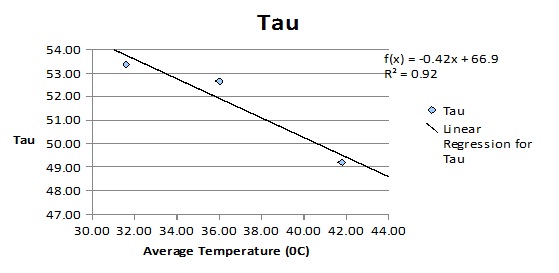
![]() = (66.90-0.415
= (66.90-0.415![]() T) where T is the temperature
T) where T is the temperature