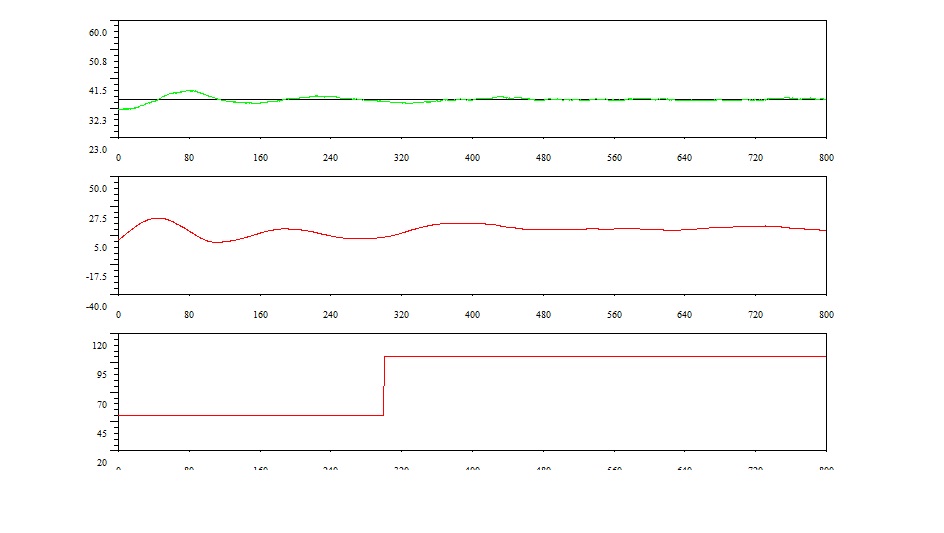
The results of the experiments carried out for the self tuning PID controller using Ziegler Nichols method are shown. The
upper plot shows the variations of the set point temperature (the black line) and the actual temperature (the purple line)
in the SBHS. The second plot shows the control effort and the third shows the fan input.
Figure 9.36:
Results for Fan Input change from 50 to 100 given to Self tuning PID Controller designed using Ziegler Nichols method
|
|
In this system also, on encountering the fan input change, the temperature remains close to the set point. Notice the change
in the control effort profile when the change in the fan input is given.
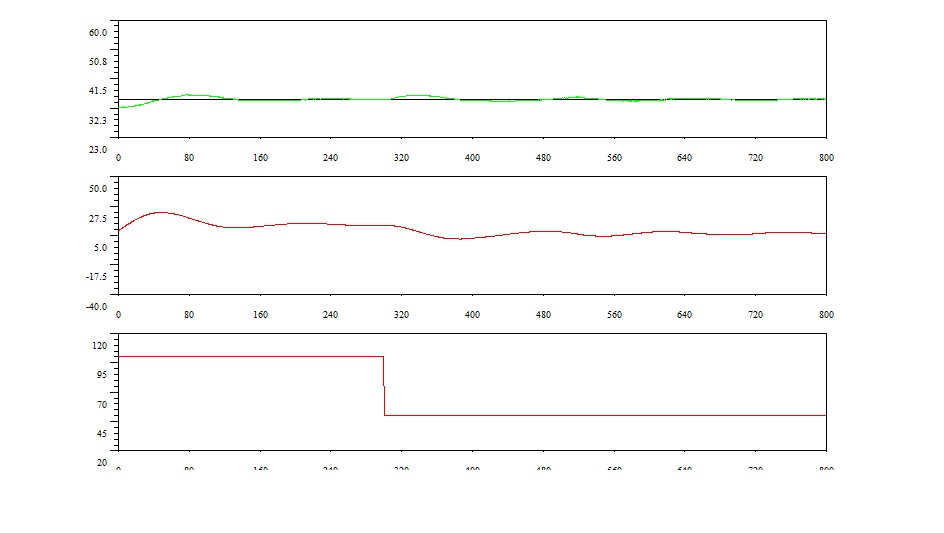
Here, result for the fan input going from 100 to 50 is also shown.
Figure 9.37:
Results for fan input change from 100 to 50 given to self tuning PID controller designed using Ziegler Nichols method
|
|
In this figure also, the temperature clearly increses a bit when the step change in the fan input is encountered. However,
it quickly stabilises back and continues to be close to the set point.
For comparison, corresponding results are also shown for conventional PID controllers designed using Ziegler Nichols tuning.
Figure 9.38:
Results for the fan input change from 50 to 100 to conventional PID controller designed using Ziegler Nichols tuning
|
|
Figure 9.39:
Results for the fan input change from 100 to 50 to conventional PID controller designed using Ziegler Nichols tuning
|
|
rokade
2017-04-23