Next: PID Controller using Ziegler Up: Disturbance Rejection Previous: PI Controller Designed by
|
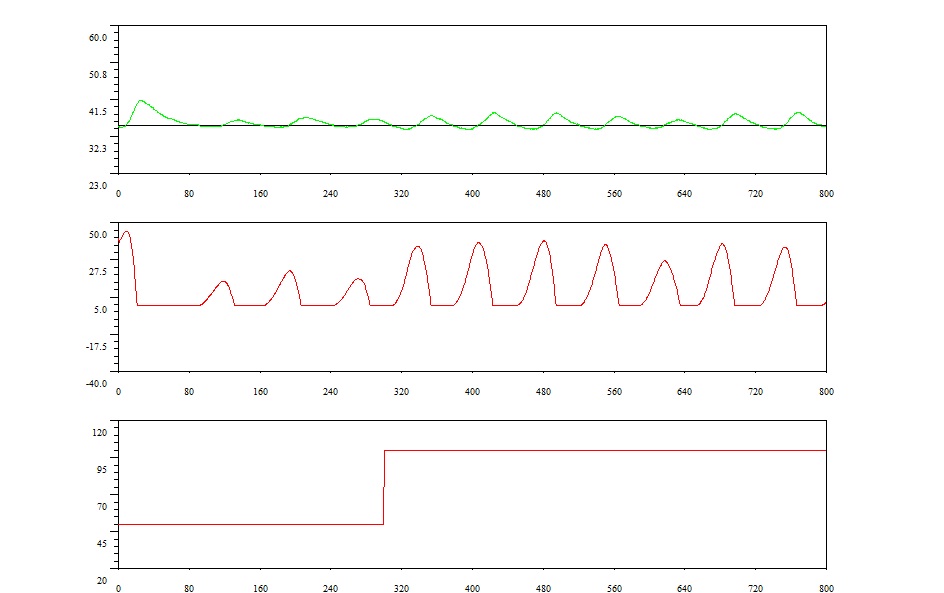
Even on encountering the fan input change, the temperature remains close to the set point. Notice the change in the controller behaviour on encountering the fan input change. Here, result for the fan input going from 100 to 50 is also shown.
|
Here, a change in the control effort can be noticed. This change has been brought by the PI Controller to keept the temperature close to the set point.
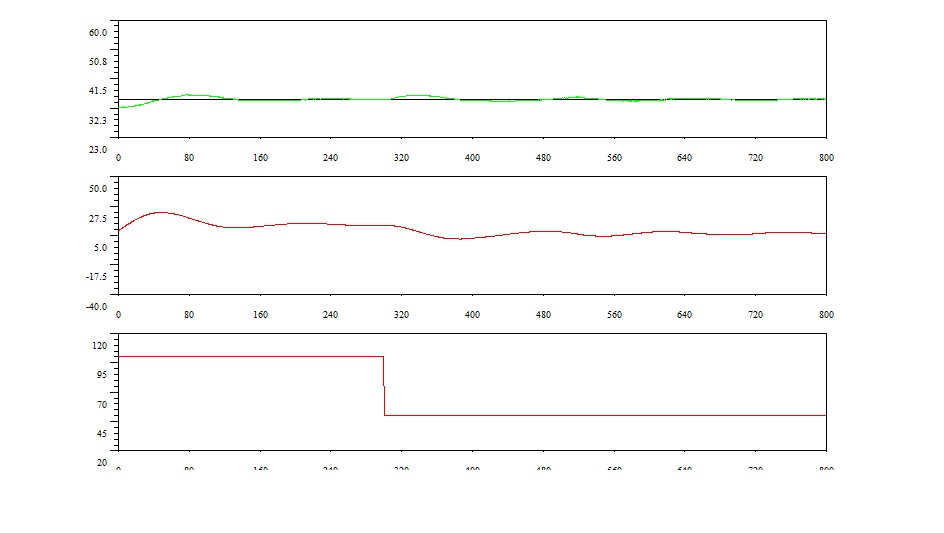
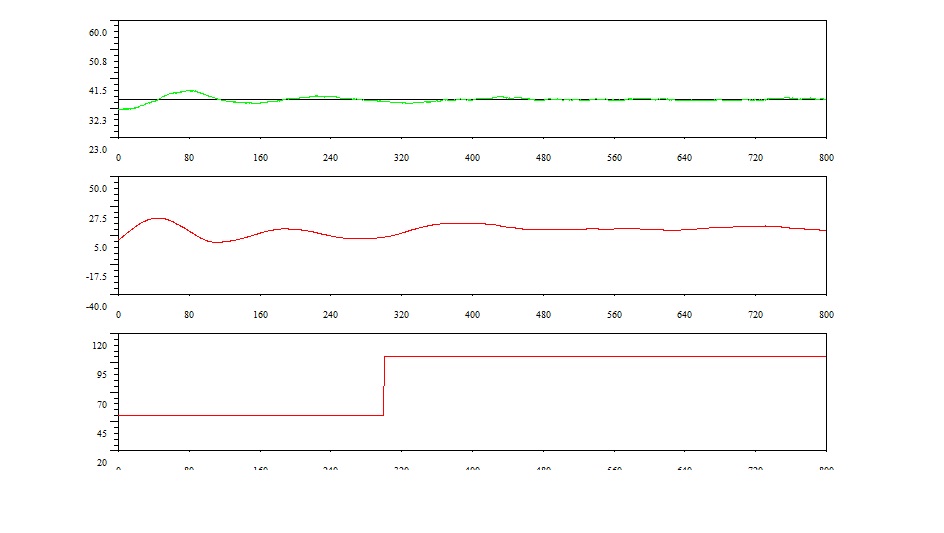
From the above two results, it is clear that the self tuning controller designed with direct syntheis has successfully
rejected the disturbance.
For comparison, corresponding results are also shown for conventional PI controllers designed using Ziegler Nichols tuning.
 |
|
|
rokade 2017-04-23