Figure 10.7:
Xcos output for positive Step Change and (We, Wu)=(1,1)
|
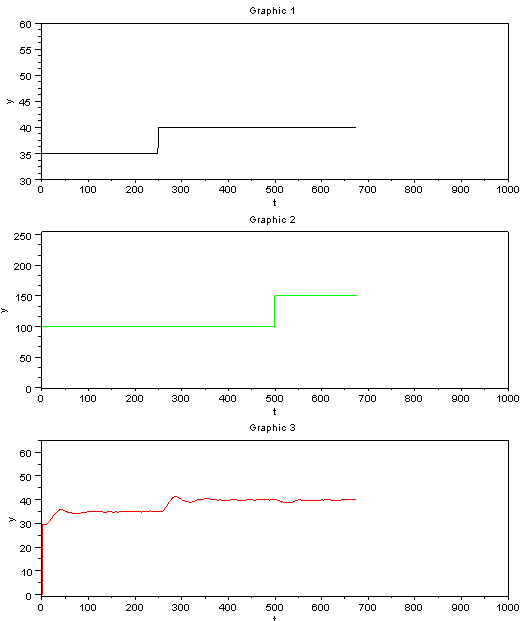 |
Here we can clearly see the expected output. Providing a positive step to temperature set point at 250 seconds, increased heater value as per the control effort put in by MPC. A positive step in fan at 500 seconds, decreased the temperature below its set point and hence heater value increased to take the temperature close to its setpoint.
Figure 10.8:
Temperature and Heater plot
|
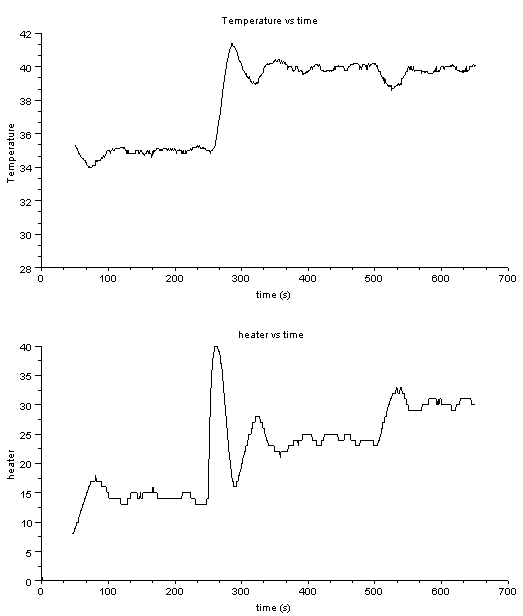 |
As can be clearly seen, the heater graph follows the expected trend that we talked of in the last page. Also, note that the temperature variation can be clearly seen from this graph.
This graph shows the result for the case, where we had same weighting factors for both error and manipulated variables (We and Wu). We will now see if changing both of these is going to have any effect on the control behavior.
So, we now try an experiment with both We and Wu increased to 10.
rokade
2017-04-23