Figure 10.9:
Xcos output for positive Step Change and (We, Wu)=(10,10)
|
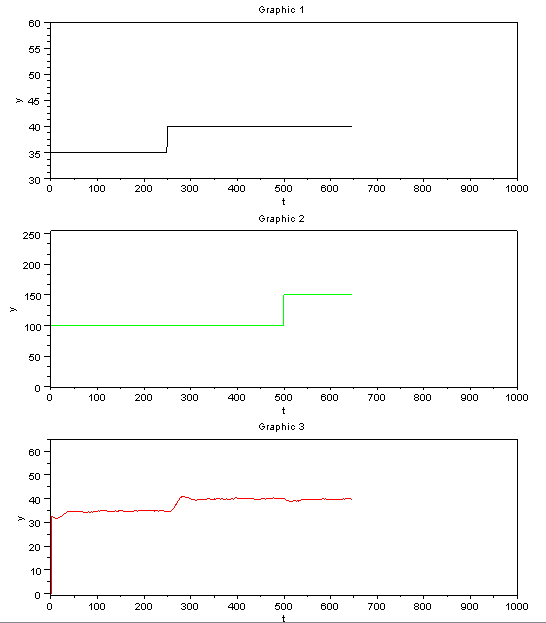 |
Using the same logic as has been explained in the last section, we expected to see similar temperature and heater value profiles for the positive step change in temperature set point and the fan. (Heater graph is shown in the next page along with the temperature on an expanded scale). In this experiment, we increased We and Wu both to 10 from 1 and wish to observe if this changes the response of the plant.
Figure 10.10:
Temperature and heater plot
|
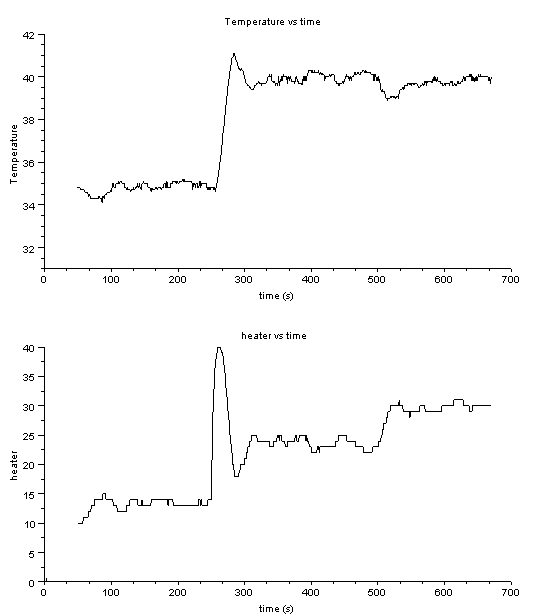 |
The results here are almost the same as that mentioned in the last section (where We and Wu both were 1). So, we can for the time being keep in mind that We and Wu isn't actually much affected the output. We now will carry out the experiment for even higher We and Wu (say 40) and see if it really does affect the output much.
rokade
2017-04-23