PI Controller Designed by Direct Synthesis

The results of the experiments carried out for the self tuning PI controller using direct synthesis method are shown. The upper plot shows the variations of the set point temperature (the black line) and the actual temperature (the green line) in the SBHS. The lower plot shows the control effort.
Figure 9.14: Result for self tuning controller designed using Direct Synthesis for set point going from 32$ ^0$C to 37$ ^0$C
Image step32to37

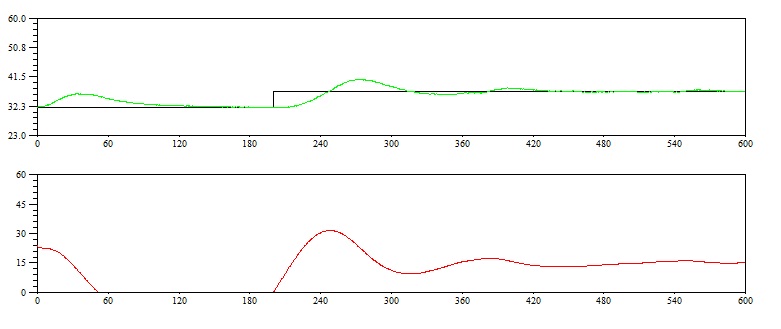
Although there is a small overshoot, the controller is able to make the actual temperature follow the set point temperature quiet closely. Looking at higher values of set point changes, the result for set point change going from 35$ ^0$C to 45$ ^0$C is shown.

Figure 9.15: Result for self tuning controller designed using Direct Synthesis for set point going from 35$ ^0$C to 45$ ^0$C
Image step35to45

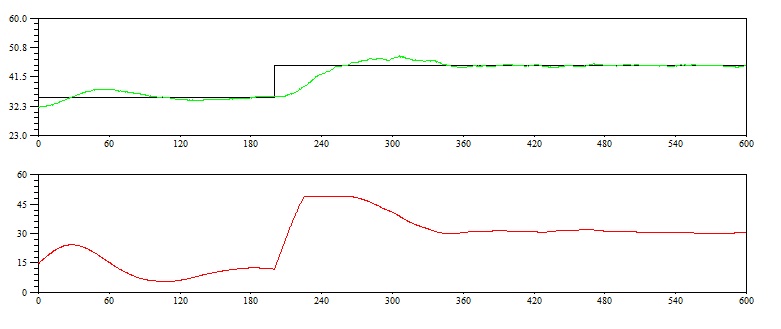
For a higher set point change also, the controller is able to make the temperature follow the set point closely. Notice the abrupt change in the control effort as soon as the step change in the set point is encountered.
For comparison, results of experiments done with conventional PI controller designed using the Direct Synthesis method are also shown.

Figure 9.16: Result for conventional controller designed using Direct Synthesis for set point going from 32$ ^0$C to 37$ ^0$C
Image step32to37

Figure 9.17: Result for conventional controller designed using Direct Synthesis for Set Point going from 35$ ^0$C to 45$ ^0$C
Image step35to45
As it can been seen from the graph, the self tuning controller stabilised the temperature faster.

rokade 2017-04-23