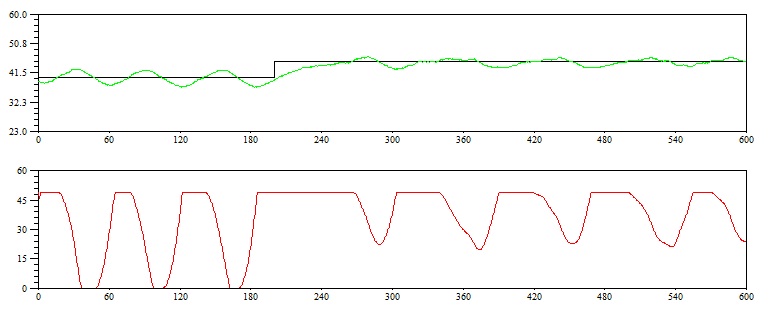
The results of the of the experiments carried out for the self tuning PI controller using Ziegler Nichols tuning method are
shown. The upper plot shows the variations of the set point temperature (the black line) and the actual temperature
(the green line) in the SBHS. The lower plot shows the control effort.
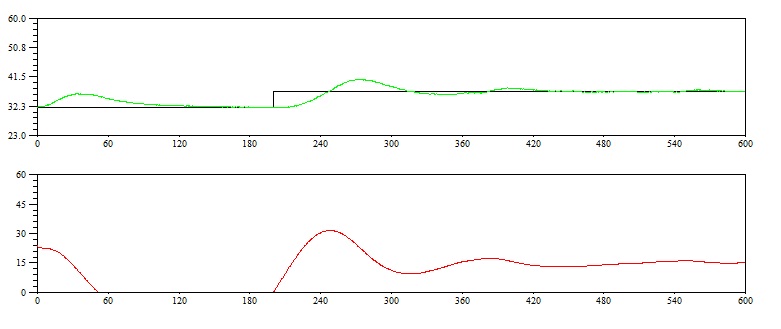
Figure 9.18:
Result for self tuning controller designed using Ziegler Nichols Tuning for set point going from 32 C to 37C
 |
Although there are oscillations, the temperature remains near the set point. The result for a higher value of set point
change is also shown.
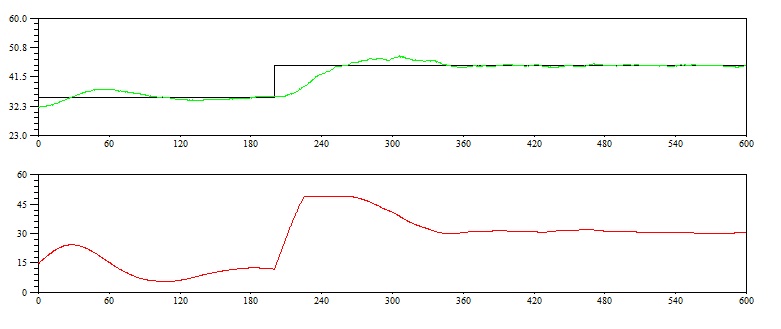
Figure 9.19:
Result for self tuning controller designed using Ziegler Nichols Tuning for set point going from 35C to 45C
|
|
For this experiment, the controller is able to make the temperature follow the set point closely. The fluctuations
may be due to noises and the surrounding conditions.The plot for result of an experiment with another value of set
point change is also shown.
In this experiment too, the controller is able to keep the temperature close to the set point and it stabilises fast.
For comparison, results of experiments done with conventional PI controller designed using the Ziegler Nichols method are also
shown.
For set point change from 40C to 45C, the self tuning controller showed small oscillations, but the conventional
controller shows bigger oscillations.
rokade
2017-04-23