Experiments were performed as shown in table above for implementation of MPC. We carried out experiments in which both positive and negative step changes were given to Set point and Fan (disturbance variable) and the output response was obtained by application of MPC. We also have performed several experiments to study the effect of change in the values of q (control horizon) and tuning parameters - error and manipulated variable weighting factors.
The details of the experiments mentioned in this report has been tabulated in the table given in the next page. The first column of the table represents the experiment version (or number). For all the outputs and their figures, we have mentioned only their experiment version (or number) to tag them. Also note that the data files for these experiments are also named as per their experiment version number. p and q mentioned in the table represents the prediction and control horizon respectively.
Please note: For all the above experiments and graphs, we adhered to:
- Scilab Version: 5.2.2
- SBHS number: 12 (remotely accessed)
- Sampling time: 1 second
For graphs: Until and unless mentioned, Graphic 1 represents the Temperature set point, Graphic 2 represents the Fan and Graphic 3 represents the Temperature. Also, please note that there are two types of graphs. The first graph, containing Graphic 1, Graphic 2 and Graphic 3 were directly obtained via mscope of xcos. The graph following this in all the experiments is the temperature and heater value graphs, which were obtained from the data (from the text file downloaded from the server after each experiment).
Figure 10.2:
Experiments performed
|
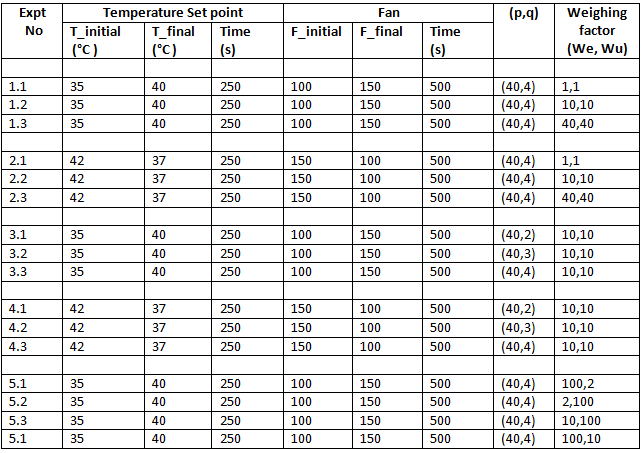 |
All the experiments mentioned in this report has been labeled as shown in this table. This table is just a summary of all the parameters that was used for the corresponding experiment. Details on the inputs and a description of the output observed for each case has been mentioned in the corresponding section of each experiment.
rokade
2017-04-23